
From assessment design to a fundable plan
AptitudeIQ carries the full assessment lifecycle: configure the questions and scoring logic, guide every participant through a consistent experience, analyze results across the organization, and generate findings, recommendations, roadmaps, and reports.
All figures on this page come from a sample assessment of Acme Pharma, a fictional company used for illustration.
Six steps, from expertise to evidence
- 1
Configure
Define capabilities, questions, score meanings, maturity statements, and recommendations.
- 2
Invite
Assign participants and the organizational attributes needed for meaningful analysis.
- 3
Assess
Participants see each question, maturity statement, and the meaning of every score.
- 4
Analyze
Calculated results appear in dashboards across capabilities and organizational dimensions.
- 5
Deliver
Generated findings, recommendations, roadmaps, and reports support the engagement.
- 6
Plan
Consultant-assisted financial analysis connects improvements to CAPEX, OPEX, risk, and value.
Encode the expertise behind the assessment
The framework is configured once, so every participant receives the same definitions and every engagement follows the same scoring logic.
- Capabilities, competencies, and assessment questions
- The maturity statement and meaning attached to each score
- Recommendations mapped to capability questions and results
- Self-service authoring or Xendat-assisted configuration
How consistently is the process followed?
Choose the statement that best reflects the current state.
The need is recognized, but practice depends on individuals.
Some documented practice exists, but adoption is inconsistent.
The process is documented, standardized, and regularly followed.
Every competency, scored 0–5
Each competency is evaluated across five dimensions — People, Process, Technology, Strategy, and Standards — and rated on a consistent 0–5 scale. Averaging those ratings gives each dimension a score, and averaging the dimensions gives the overall capability score.
In the sample FAIR assessment, the dimension scores made the story obvious: strong tooling, weaker people and process.
Sample figures from a FAIR Data assessment (fictional Acme Pharma).
Six levels, one clear position
Scores roll up into a maturity level so everyone shares the same language for where things stand today — and what "better" looks like next. The sample assessment landed at Level 2 — Opportunistic.
Unaware
Data capabilities are not recognized or managed; practices are ad hoc and depend on chance.
Aware
The need to improve is recognized, but efforts are isolated, undocumented, and reliant on individuals.
Opportunistic
Sporadic implementation of good practices, but lacking standard frameworks and cross-functional alignment.
Practiced
Practices are standardized, documented, and consistently followed across teams.
Operational
Capabilities are measured, managed, and embedded into operations across the organization.
Strategic
Capability is integrated into strategy — resilient, self-reinforcing, and driving lasting advantage.
Findings that explain the scores
The report translates numbers into insight — a narrative of strengths, gaps, and what to do about them. In the sample, strength concentrated in Technology while People and Process held the organization back.
Technology
Investment in advanced data platforms and tools — the clear strength, but under-exploited without the right processes and talent.
Process
Some documented processes exist, but they are not standardized across the organization or consistently followed by all teams.
People
Limited data-management skills across business units point to a clear need for training in FAIR principles and day-to-day application.
See where averages hide the real maturity gaps
Each participant can carry the organizational attributes that matter to the engagement. AptitudeIQ uses those dimensions to compare results and reveal where experience, adoption, or capability differs across the business.
Illustrative segmented results. Dimensions are configured to match the organization and assessment.
What you receive
Every engagement produces a detailed, presentation-ready report — the same document leadership uses to align on where things stand and what to do next.
- Overall maturity level and per-dimension scores
- Written findings for each capability, with strengths and gaps
- Short- and long-term roadmap recommendations
- Financial impact and ROI analysis for the proposed roadmap
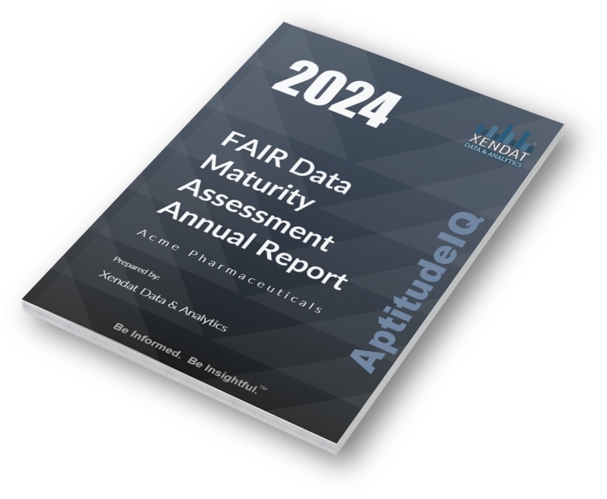
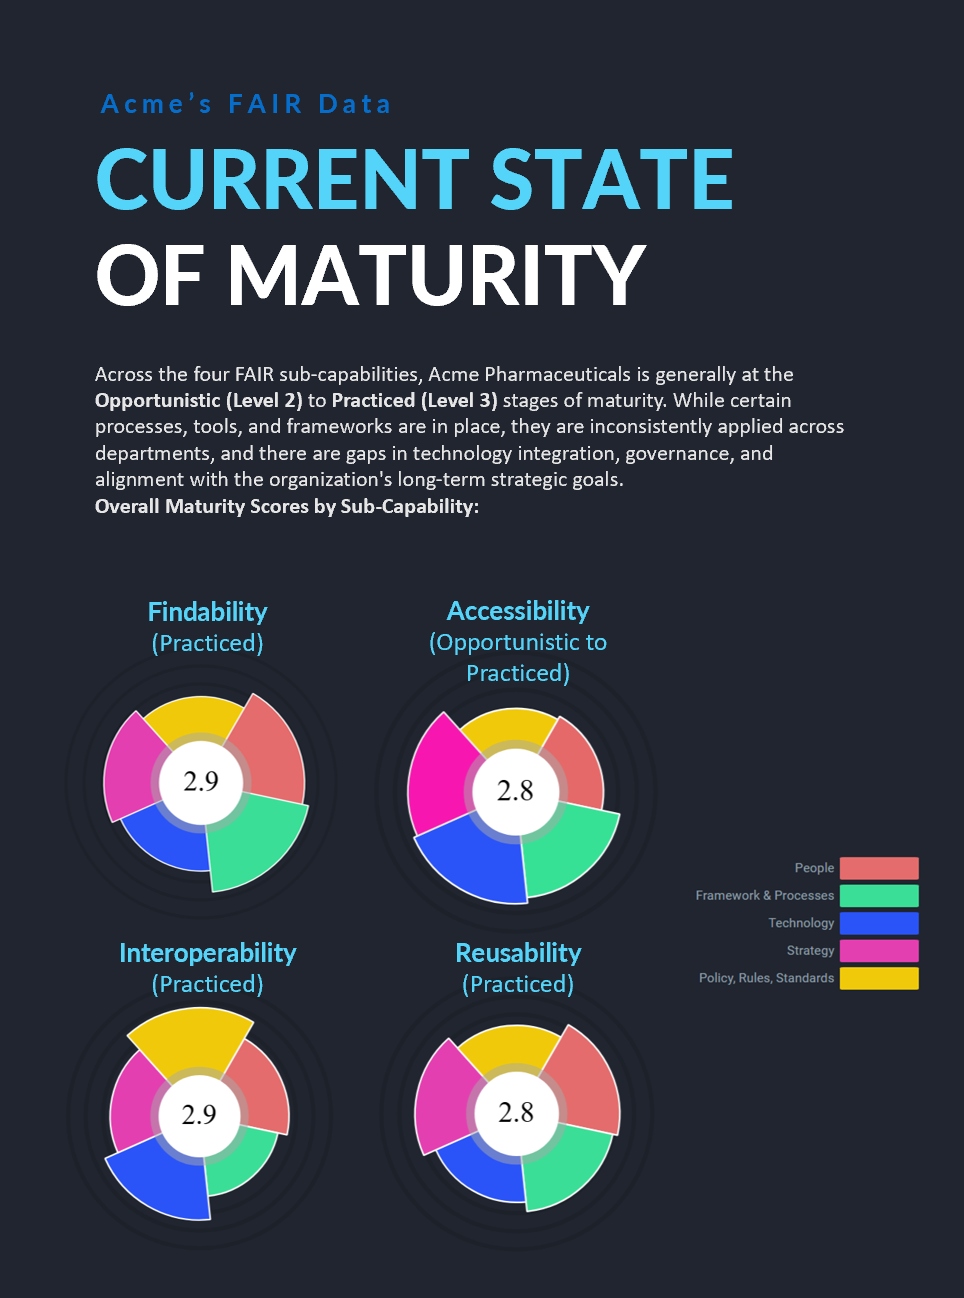
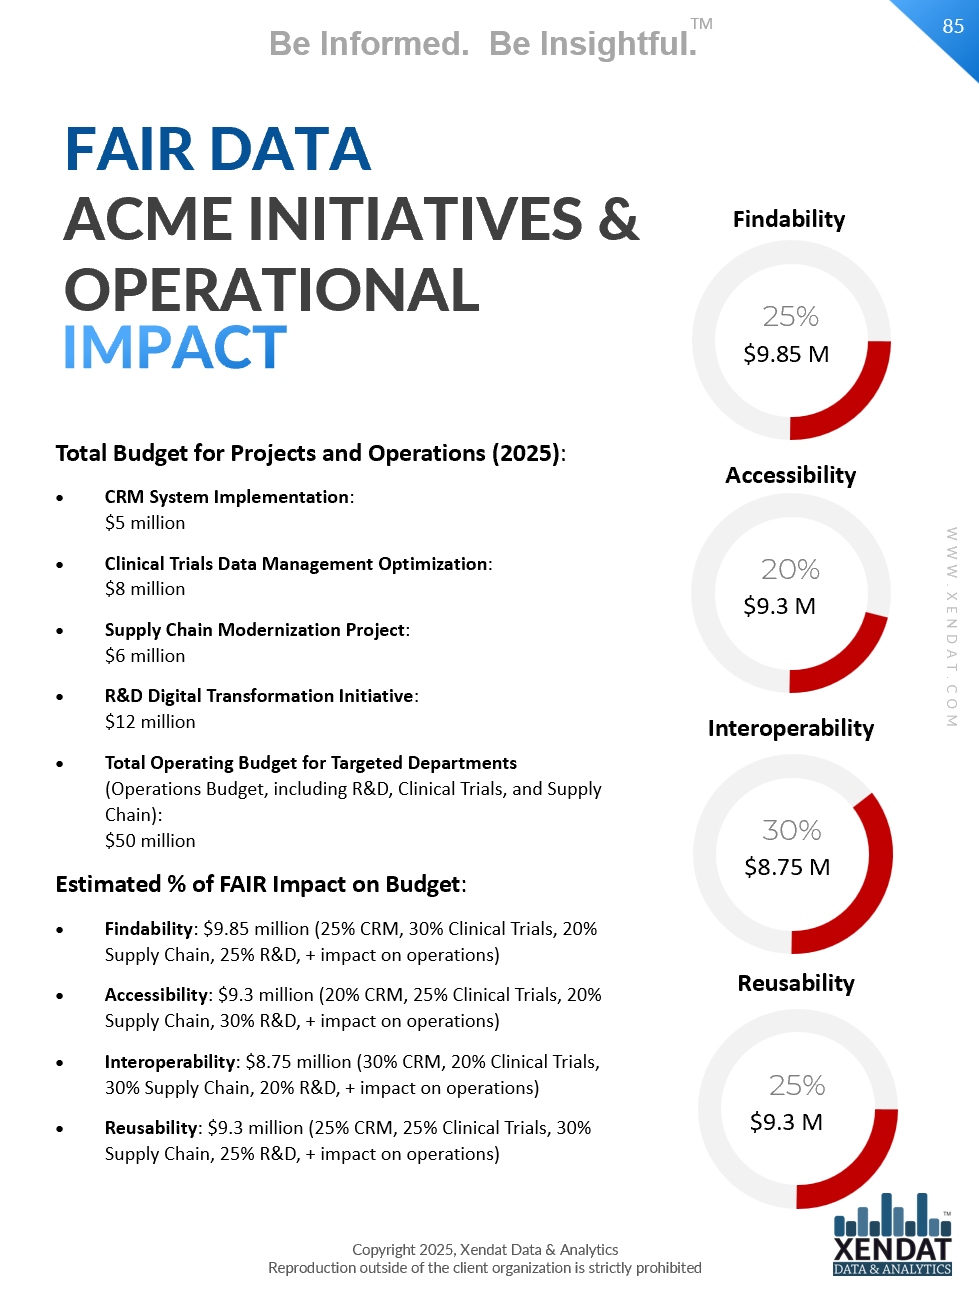
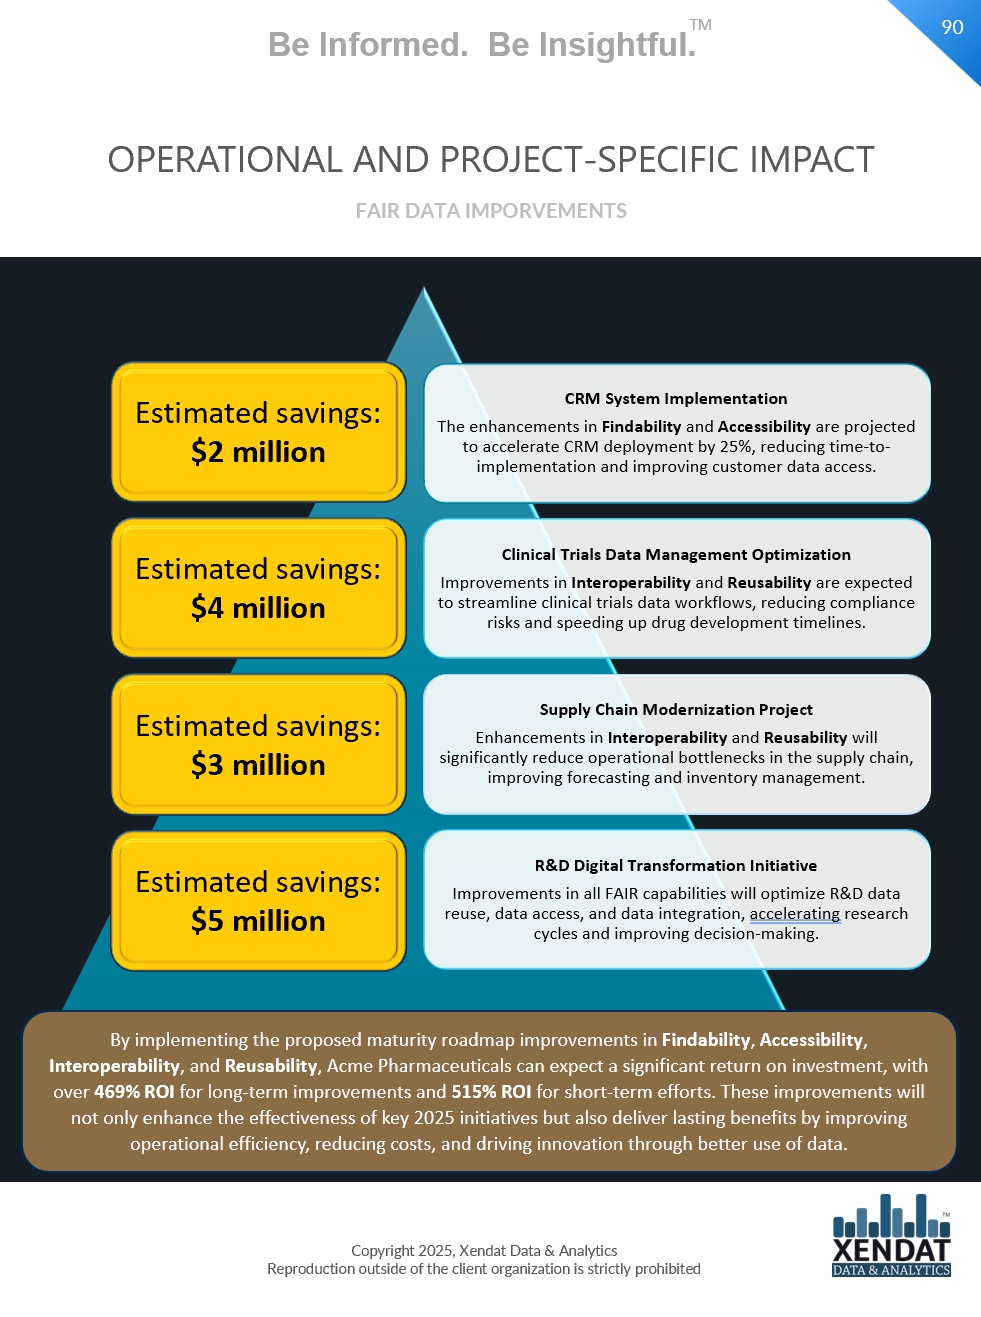
Sample pages shown are from a demonstration FAIR Data report for the fictional Acme Pharmaceuticals.
A prioritized path to the next level
Every gap becomes an action. The roadmap splits into near-term wins and longer-term structural change, each tied to the dimensions and principles the assessment scored.
- Findability — stand up a centralized metadata management system for consistent tagging and better discovery, with staff training on standards and tools.
- Accessibility — roll out a standard data-access and governance process with role-based access controls across systems.
- Interoperability — integrate key data systems using standardized formats and APIs for seamless exchange between departments.
- Reusability — establish data stewardship to improve documentation and quality, aligning practices to company-wide standards.
- People — launch a company-wide data-literacy program building FAIR skills, with key personnel trained in governance and analytics.
- Process — establish a cross-functional data governance body to embed standardized processes into existing workflows.
- Technology — extend existing platforms with advanced analytics that automate discovery, quality checks, and reporting.
- Strategy — align the data strategy with broader business objectives, backed by senior leadership and a long-term improvement plan.
- Standards — implement a company-wide framework so all units follow consistent practices for storing, managing, and sharing data.
A roadmap connected to business planning
The platform outputs and consultant analysis connect maturity gaps to proposed initiatives, CAPEX, OPEX, productivity, risk, and expected benefits. The figures below are illustrative assumptions from the fictional Acme FAIR assessment, not guaranteed outcomes.
Initial investment over the next 12–18 months — covering metadata management systems, training programs, and process standardization.
Acquiring and implementing new tools, particularly for metadata management and system integration.
Training, standardized-process development, and standing up a data governance office.
Remaining budget covers contingency and ongoing operational costs.
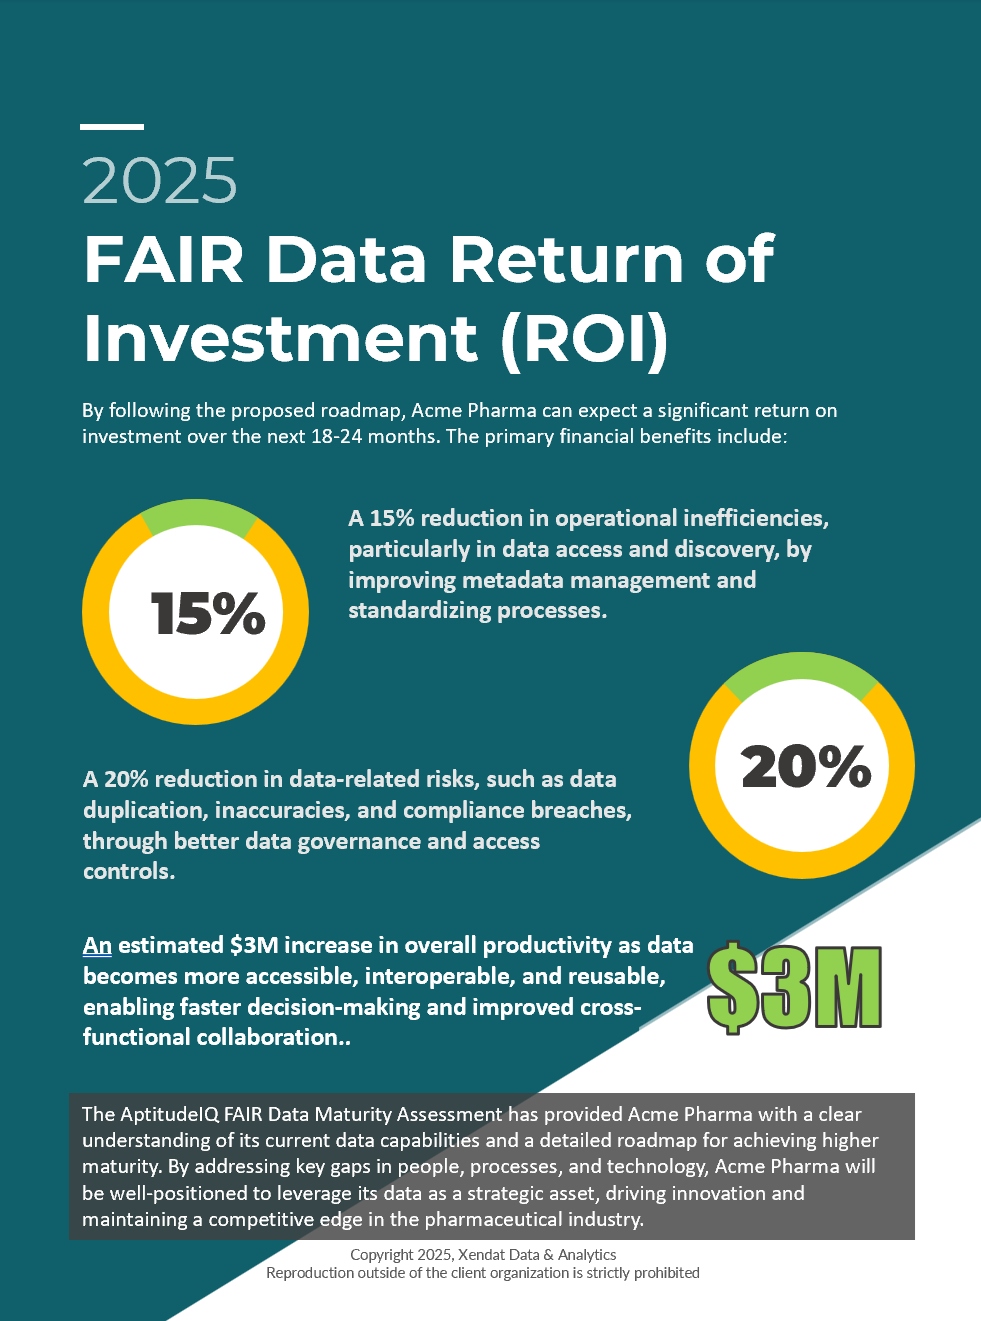
Expected return over 18–24 months
Reduction in operational inefficiencies — particularly in data access and discovery — from better metadata management and standardized processes.
Reduction in data-related risks such as duplication, inaccuracies, and compliance breaches, through stronger governance and access controls.
Estimated increase in overall productivity as data becomes more accessible, interoperable, and reusable — enabling faster decisions and better collaboration.
Run this path for your organization
Pick an assessment, choose a scope, and get the same clear line from score to maturity level to a fundable roadmap.